Jared Tomlin started out back in 2018 as the Stormwater GIS intern for Martinsburg, WV, before becoming GIS Analyst, then Stormwater Coordinator / GIS Administrator, and now Stormwater Program Manager. So perhaps it’s unsurprising that he sees the benefits and possibilities that Geographic Information Systems (GIS) bring to stormwater management. He’s the one that brought GIS and stormwater together in Martinsburg, and he’s been a fierce advocate for using new technologies to improve water quality in the city and the surrounding region ever since. The City of Martinsburg even won a 2022 Special Achievement in GIS Award at the Esri User Conference.
Maps Show Us the World, Literally
Maps are such common technology that it’s often easy to forget that they’re technology at all. But stop and think for a moment about what maps do: they show us the world. They show us how places connect to one another, so that we can get from here to there. When it comes to understanding stormwater, maps show how a storm drain here connects with a local receiving water there, how water moves across the landscape.
Maps show us how it’s all connected, in a way that rows of data points just can’t. With maps, we can see, literally, what the numbers mean. GIS are maps with computing power behind them, maps that we can interact with. Maps that can do even more.
This is what Jared brought to Martinsburg, and applied to stormwater management.
Stormwater Software Built On Esri’s ArcGIS
Esri is the world’s leading mapping technology company. When Jared arrived at Martinsburg, the city already had a subscription to Esri’s ArcGIS service, but “we weren’t using all of the tools available to us,” Jared says.
Jared wanted to use the power of GIS to map and organize Martinsburg’s stormwater program. Seeing stormwater assets on the map is a good start. But Jared wanted to understand their impact. If a stormwater asset gets clogged and stops functioning well, he wanted to be able to understand what happened to the water quality downstream. And see how water quality improved if that asset got cleaned and returned to peak functionality.
Jared went looking for stormwater software that could help him do this, and his stormwater colleagues in Berkeley County, where Martinsburg is the county seat, told him about 2NFORM, which they were using to build their stormwater program.
Berkeley County, WV is using 2NFORM to build a modern stormwater program from scratch
See case study2NFORM is a robust software platform that provides intelligent stormwater management and compliance, purpose-built by stormwater scientists and experts to meet the needs of busy MS4 permit holders. Foundational modules handle information management and reporting on the six minimum control measures required by most MS4 permits. Additional modules empower stormwater managers with advanced analytics and planning capabilities, using the data collected for compliance to drive actual improvements in water quality.
And 2NFORM is built on Esri’s ArcGIS. With 2NFORM, Jared and the rest of the stormwater team can see their entire MS4. Different modules offer views of structural stormwater assets, illicit discharge events, construction sites that require MS4 inspections, how trash accumulates in the city, and much more.
Mapping Stormwater in Martinsburg
The difference between a static map — like a big paper map on a wall — and an interactive, digital map is huge. For starters, the digital map can contain a lot more information. And it can take data, analyze it, and show the information in a way that’s very easy to, literally, see.
An EPA audit in 2020 emphasized that Martinsburg needed to do a better job of tracking their structural stormwater assets and their illicit discharge detection and elimination (IDDE) efforts. “We had stormwater assets on a map, but that was it — there was no schedule for maintenance or any understanding of what was there,” Jared says. “With 2NFORM, that’s changed. The interactive maps help us see what needs doing.”
With 2NFORM, Jared can do so much more than just see where the stormwater assets or the illicit discharge event are. He can see what kind of asset is in each place, how well it’s functioning, whether it’s due for an inspection or maintenance, and the history of inspections or maintenance. And IDDE investigations are easier to manage as well: drop a pin on a map to show where the discharge happened, fill in a standardized form to document the event, and complete inspections and add pictures and follow up reports right in the software.
Maps + Analytics Minimize Effort and Maximize Impact
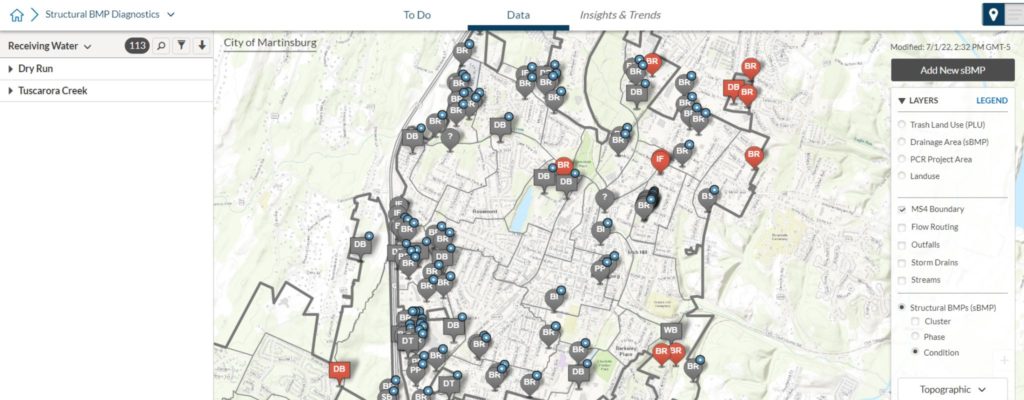
2NFORM uses simple color codes to show what needs doing next. Stormwater Coordinator Becca Russell is a big fan of this feature. “Most of the structural stormwater assets in the city were not functional, and it will be a long process before they are,” Becca says. “Being able to see them all on one map, with a red mark to show high urgency items, is really great.”
Jared and Becca puzzled for years over how to build a dashboard that could guide their daily efforts. “There’s so much to do. Where do we start?” Jared says. “Red dots on a map don’t sound like a lot, but they’re a huge help. That’s what we do when we come into work: we address those red dots.” Those red dots might be structural assets that need maintenance, IDDE inspections that require a follow up, or other urgent stormwater business.
Interactive maps also make it much easier to communicate the importance of stormwater to the public, and the hard work of stormwater management to regulators. Jared collaborated on a tool that allows people in the Eastern Panhandle region of West Virginia — which includes Martinsburg — to “Find Your Watershed.” Residents can use the interactive site, built on ArcGIS, to search for addresses and see which watershed they belong to and which rivers connect to which watersheds. It lets people see how they are part of their water landscape. This is a terrific example of meaningful public education and outreach.
Becca is looking forward to her first MS4 annual report with 2NFORM, when the software will take all of the information already in it and turn that data into charts, graphs, summaries, all at the click of a button.
Jared appreciates how much smoother his day-to-day stormwater work is with 2NFORM’s GIS-based interactive maps. But he’s really excited to see how the built-in analytics help him and his team improve water quality for the community. The stormwater science that 2NFORM is based on guides Jared to make data-driven decisions that will result in a measurable, verifiable impact.
“Down the road, I can’t wait to see the benefits to water quality based on our efforts. That’s the biggie, that’s our home run.” He’s confident that 2NFORM will get them there.