Struggling to navigate the complex MS4 permit requirements for reporting your program’s effectiveness? You’re not alone—many of our users face the same challenge. But here’s the good news: we’ve got a solution! By integrating the powerful, structured data system of 2NFORM with innovative ideas from our users, we’ve developed the Insights & Trends tab. This new feature offers a streamlined way to visualize and analyze stormwater program data, helping you effectively evaluate your program’s performance with ease.
What is the Insights & Trends tab?
Insights & Trends provides a simple, curated dashboard that allows you to visualize your data in new ways. Use this dashboard to uncover insights and trends for each of your programs, perform QA/QC for data entry errors, and manage data-driven programs.
By collaborating with our users to understand the critical questions that stormwater managers are asking of their data, we can curate dashboards to help answer these questions. 2NFORM’s Insights & Trends widgets and filters are pre-configured so you have program insights at your fingertips.
Insights & Trends for Illicit Discharge Incidents
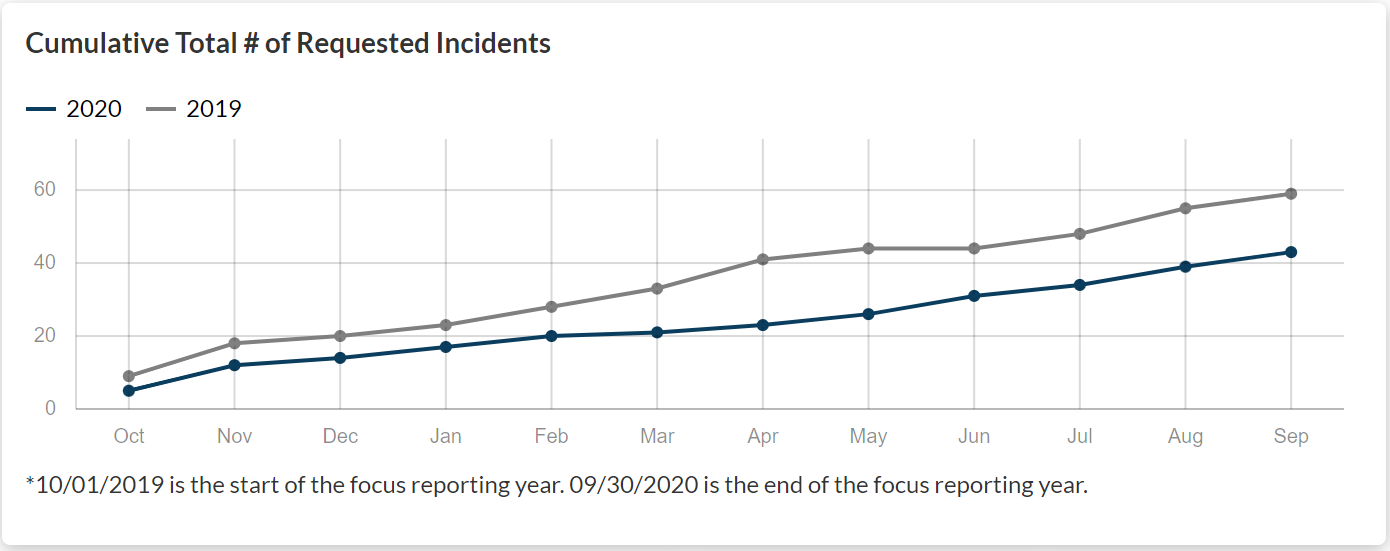
Program effectiveness evaluation requires benchmarks to evaluate the program’s ability to accomplish objectives. The objective of the illicit discharge detection and elimination regulations is to eliminate the occurrence of non-stormwater flows.
Use the line chart to identify trends in the number of requested incidents over time and compare your trends with previous reporting years.
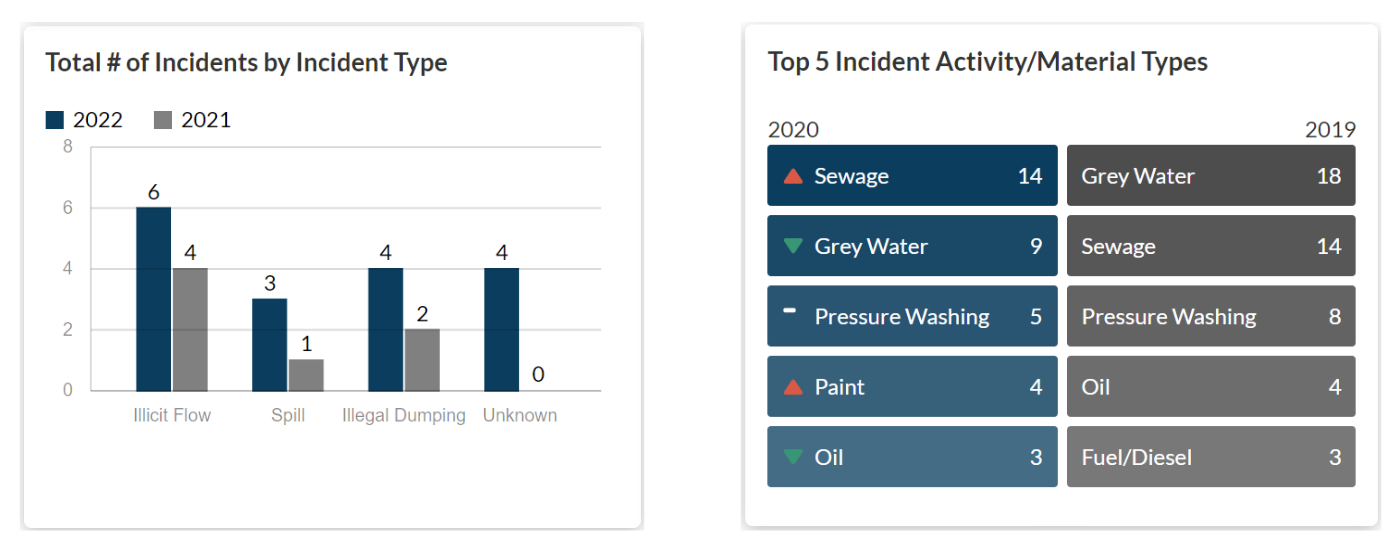
The bar chart and rankings identify the most common types of incidents in your City. These results may help you focus your public educational and outreach materials and goals for the next year.
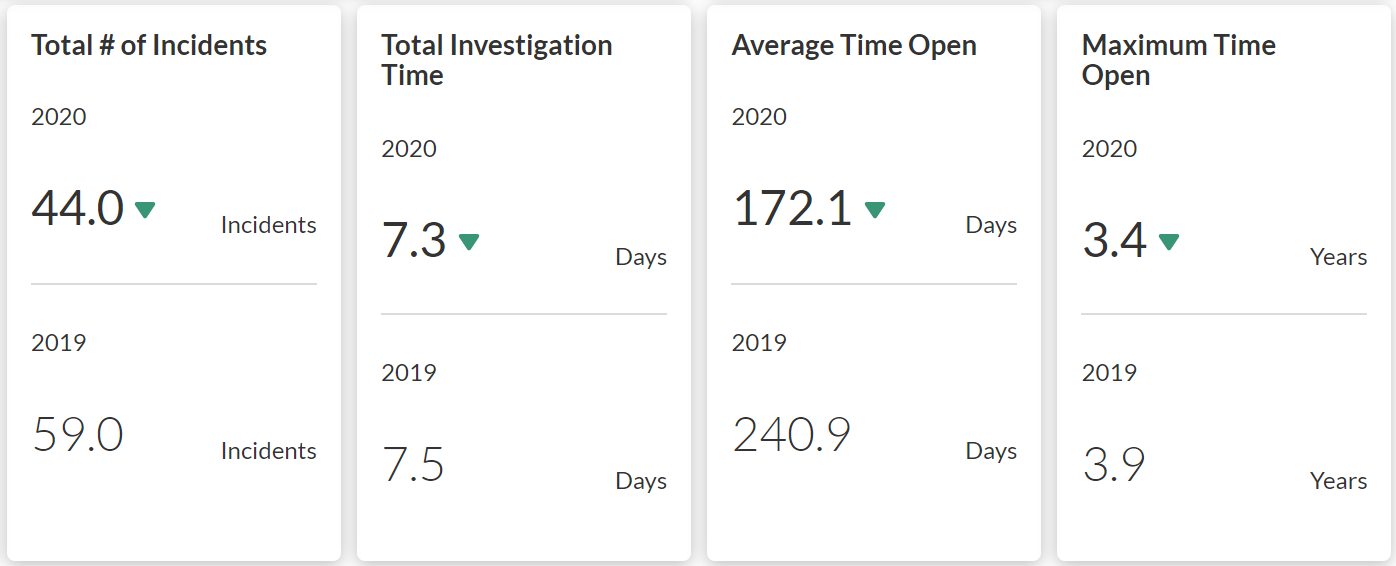
Use the four KPI widgets along the bottom to better understand your staff’s level of effort regarding investigation times and evaluate changes in the effectiveness of team resources.
Insights & Trends vs. Annual Reporting
Insights & Trends and Annual Reporting aggregate data for each program over the year into useful summaries and charts. However, unlike Annual Reporting, Insights & Trends is only available to you and your internal team; no regulator will have immediate access to these dashboards.
Insights & Trends also allows for comparing and analyzing two reporting years, while Annual Reporting focuses on describing all the data and effort for a single year.
More Insights from 2NFORM Coming Soon
Insights into Illicit Discharge Incidents are just the beginning! Next are insights for Industrial/Commercial, Municipal Maintenance Catch Basins, Outfalls, and Structural BMPs. We are excited to bring you Insights & Trends to every minimum control measure module. Stay tuned!
As always, please let us know your thoughts in our feedback forum! We’re always open to new ideas from our users. Send us feedback!